The ASCE 7-22 standard, adopted by Sacramento’s building department, classifies much of the metro area as Site Class D or E due to deep alluvial deposits—but the real picture is far more nuanced. Seismic tomography gives us that nuance. The American and Sacramento Rivers have spent millennia carving channels, depositing sands, silts, and occasional gravel lenses that vary sharply over short distances. A conventional borehole log tells you what’s at one point; a tomography line connects the dots. We run refraction surveys for shallow bedrock mapping—critical near the eastern edge of the city where the Modesto Formation rises—and reflection profiles when we need to image basin structure at depths of 100 to 300 feet. The result is a P-wave or S-wave velocity model that feeds directly into site-specific ground response analysis under Chapter 21 of ASCE 7. For projects near the Natomas Basin, where the transition from Holocene levee deposits to Pleistocene terrace material can be abrupt, we often pair MASW with tomographic lines to constrain Vs profiles across the full site footprint before foundation design begins.
Velocity models from seismic tomography let Sacramento engineers move beyond a single Vs30 number and see the actual layering that controls site amplification.
Scope of work in Sacramento
Risks and considerations in Sacramento
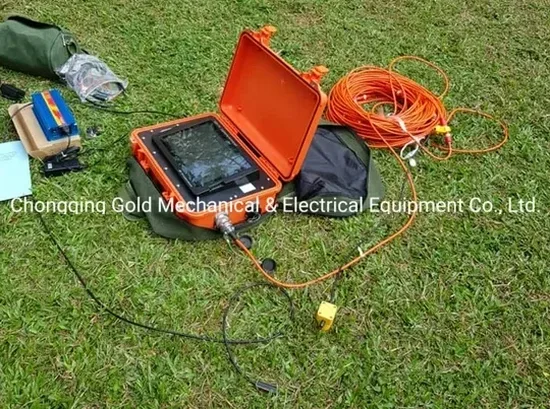
The weight drop source we deploy on Sacramento streets is a trailer-mounted accelerated system—it strikes a steel plate with consistent force while a trigger circuit sends the time-zero signal to the seismograph. In residential areas near East Sacramento, we switch to a sledgehammer-and-plate setup to keep noise and vibration within city limits. The real risk with seismic tomography isn’t the equipment; it’s misinterpretation of a velocity inversion. When a stiff layer overlies a soft one—common in the Sacramento basin where desiccated clay crust sits atop saturated silt—the refracted arrival may mask the low-velocity zone beneath. Our processing workflow includes waveform analysis and synthetic modeling to catch these hidden layers before they become a problem. A missed low-velocity lens under a spread footing can amplify seismic shaking in ways that a simple Vs30 classification won’t predict. That’s why we run multiple shot points per spread and cross-check with borehole data or CPT logs whenever available—the tomography model has to agree with the direct measurement, or we keep refining the inversion.
Our services
Our Sacramento tomography work spans two primary survey configurations, tailored to the density of urban infrastructure and the depth of investigation required.
Refraction Tomography
Ideal for mapping top-of-bedrock, rippability, and shallow velocity structure to 100 feet depth. We deploy 24- or 48-geophone spreads with hammer or weight-drop sources, processing through tomographic inversion to produce smooth 2D velocity models. Used extensively for foundation design in the downtown Sacramento area where Pleistocene gravels control bearing capacity.
Reflection Tomography
Designed for deeper basin imaging—100 to 500 feet or more—to map the interface between Holocene alluvium and older Tertiary formations. We use a longer spread with lower-frequency geophones and a more powerful source, processing through CMP stacking and depth migration before tomographic velocity analysis. Applied in the Natomas Basin and Sacramento River corridor for seismic hazard studies and major infrastructure projects.
Quick answers
What does a seismic tomography survey cost in the Sacramento area?
For a typical 24-channel refraction tomography line with 5-foot geophone spacing and two shot points, costs in Sacramento generally range from US$2,930 to US$5,520 depending on the line length, site access conditions, and whether a weight drop or hammer source is used. Deeper reflection surveys with longer spreads and multiple shotpoints fall toward the upper end of that range. Each project requires a site-specific quote after we review the survey geometry and access constraints.
How is seismic tomography different from a standard MASW survey?
MASW gives you a 1D Vs profile averaged horizontally under the geophone spread; seismic tomography produces a 2D P-wave or S-wave velocity cross-section that shows lateral changes. In Sacramento’s alluvial environment, where channel sands pinch out over short distances, the 2D image from tomography is far more useful for spotting buried features. We often run both methods on the same spread—MASW for Vs30 and site class, tomography for the detailed velocity structure.
Can you run seismic tomography on paved surfaces in downtown Sacramento?
Yes. We use bolt-down geophones or spike-mounted receivers that couple to asphalt and concrete. The source is typically a sledgehammer on a steel striker plate with a rubber mat to protect the pavement. We coordinate with the City of Sacramento for any lane closures needed, and the survey generates far less disruption than drilling equipment.
What depth can seismic tomography reach in the Sacramento basin?
Refraction tomography typically images down to one-third to one-fifth of the spread length—so a 120-foot spread reaches 30 to 40 feet depth with good resolution. For deeper targets, like the contact between Holocene alluvium and the Mehrten Formation at 200+ feet, we switch to reflection tomography with longer spreads and a more energetic source. The maximum depth we have resolved in the Natomas Basin is roughly 350 feet using a 500-foot spread.
How do Sacramento’s groundwater levels affect the seismic data?
High groundwater—common in Sacramento, where the water table can be within 10 feet of the surface—actually improves P-wave transmission through saturated soils, giving cleaner first arrivals. However, it also reduces the velocity contrast between certain layers, which can make mapping subtle boundaries trickier. We account for this by running both P-wave and S-wave tomography where possible; S-waves are insensitive to water saturation and reveal the soil skeleton stiffness directly.